Typhoon Bualoi made landfall in Nghe An and Ha Tinh in the early morning of September 29th, 2025, causing heavy damage in the Northern and North Central regions of Vietnam. According to preliminary statistics from the Department of Dyke Management and Natural Disaster Prevention and Control, as of 5:00 p.m. on October 2nd, the storm’s impact had killed 49 people, left 16 missing, and injured 153; economic damage in some provinces reached VND 12,799 billion. The impact of the storm’s circulation caused widespread heavy rains, up to 600mm in some areas, causing historic flooding in many provinces and cities.
SAR technology has the ability to collect information on the Earth’s surface despite bad weather conditions, both day and night, making it very useful for monitoring flooding status caused by storms, floods, or heavy rain. With this information, we can devise appropriate responses, such as: choosing safe travel options, search and rescue, and relief in natural disasters.
SAR Sentinel-1 imagery is freely distributed by the European Space Agency, with a spatial resolution of 10-m, revisit time of 12 days (combining orbits can reduce this to 3 days). Our input data captures the area from Ha Tinh to Ha Giang at 5:21 a.m. on October 2nd, 2025, providing information on flooded areas at the time of acquisition due to the influence of the typhoon’s circulation (Figure 1). The image was pre-processed, with the water surface extracted and terrain shadows removed. The regular water surface layer is synthesized from OSM data, JRC data, and finalized with additional editing. These two data layers are overlapped to obtain the flooded area. The processing steps are performed on free data processing and analysis software, which are SNAP and QGIS.
The results of determined the flooded area have not been verified in the field and are for reference only.
 |
 |
| (a) | (b) |
Figure 1: Sentinel-1 imagery on (1) September 19th, 2025, and (2) October 2nd, 2025 (Source: https://dataspace.copernicus.eu/). Based on the color composite of Sentinel-1 imagery, water bodies appear dark. For the image acquisition in October, the Eastern area of Nghe An, Thanh Hoa, etc., has a greater proportion of dark regions. This highlights flooded areas.
 |
 |
 |
| (a) | (b) | (c) |
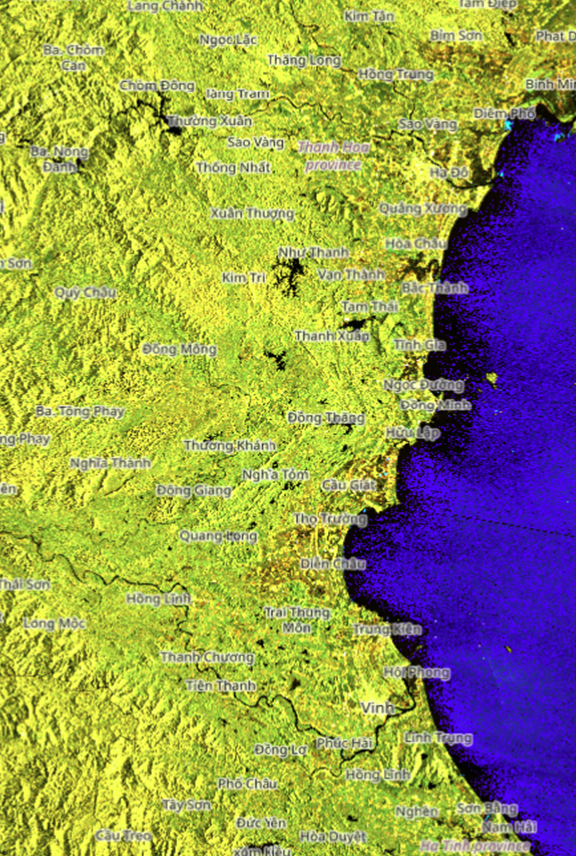
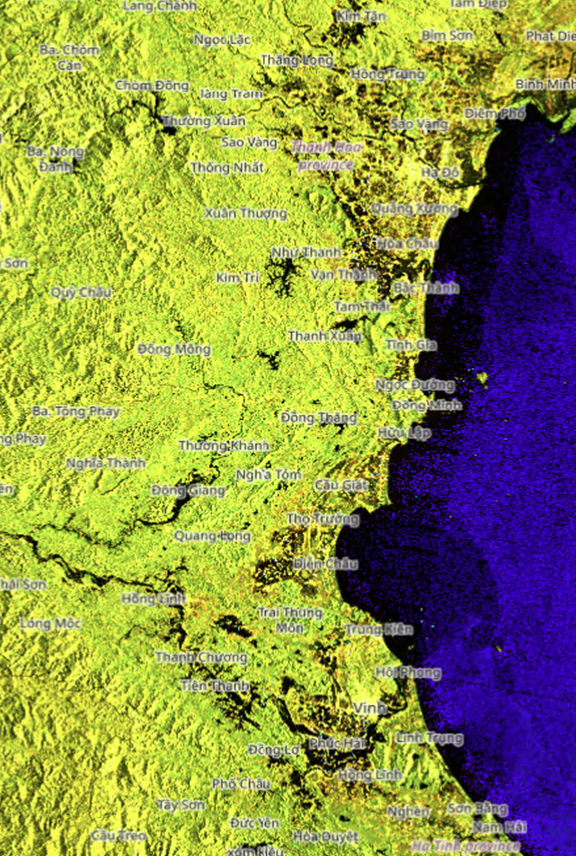
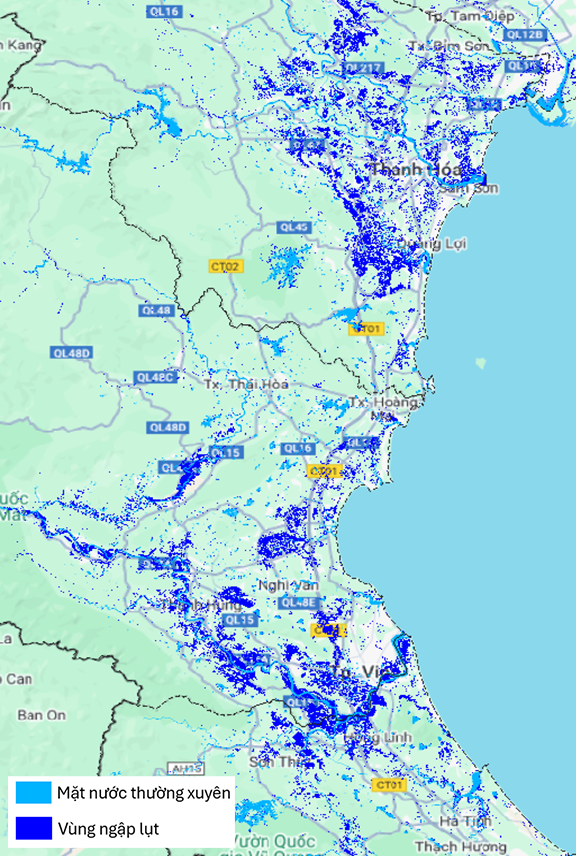
Figure 2: Sentinel-1 imagery of the area in Thanh Hoa – Nghe An on (a) September 19th, 2025, (b) October 10th, 2025, and (c) the corresponding delineation of flooded areas. In the Nghe An region, expanded water bodies are spread along the stream of Lam River, Ngan Sau River, and Ca River. In the Thanh Hoa region, massive floodings were recorded in the majority of eastern communes like Te Nong, Minh Khoi, Nong Cong, Truong Minh, Thang Tho, etc. Analytic results show the total area of the flooded area is 58.511 ha in Nghe An, and 60.162 ha in Thanh Hoa region.
 |
 |
| (a) | (b) |
(c)
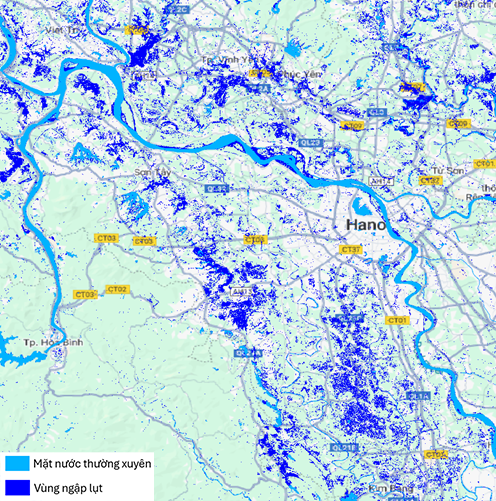
Figure 3: Sentinel-1 imagery of Hanoi city on (a) September 19th, 2025, (b) October 2nd, 2025, and (c) delineated flood map. The southern and western areas, along with the alluvial area on the left bank of the Red River are heavily flooded.
 |
|
| (a) | (b) |
(c)
Figure 4: Sentinel-1 imagery of Tuyen Quang city on (a) September 19th, 2025, (b) October 2nd, 2025, and (c) delineated flood map. This is one of many regions that have experienced the most severe flooding in history.
From Sentinel-1 SAR images, it is possible to identify fields and bare land that are flooded on a large scale quite effectively, but it is not feasible to extract flooded residential areas due to the signal acquisition characteristics of SAR technology and resolution limitations. In addition, terrain shadows can be misidentified as water surfaces. According to statistics from image analysis, in the photographed area, the provinces/cities with the largest flooded areas are: Thanh Hoa, Nghe An, Hanoi, Phu Tho, Bac Ninh, and Ha Tinh.
Figure 5: Flood inundation map caused by Typhoon Bualoi on October 2nd, 2025, processed by the VEGACOSMOS team in collaboration with VSGA
The extracted floodwater surface can be used to quickly estimate relative flood depth by applying the FwDET flood depth model (open source, free). Refer to the flood depth estimation map at HERE.
To obtain more accurate flood depth information, hydrological models or in-depth analysis are required.
Flood maps provide information on flooded areas at the time of image acquisition, helping local residents understand the current flood situation, thereby having appropriate response measures, such as: choosing safe travel options, avoiding deep flooded areas; supporting people in deep flooded or isolated areas; and at the same time providing information support for authorities in planning, prevention and emergency response when similar situations occur. These products serve to assess the extent of damage, support people’s livelihoods, as well as effectively deploy post-disaster reconstruction endeavors.
With a spatial resolution of 10m, Sentinel-1 data is useful for large-scale flood monitoring. In cases where detailed monitoring at a local scale, or continuous and proactive monitoring is required, high-resolution commercial SAR data with more frequent data acquisition is recommended. With the increasing trend of SAR imagery applications and technological advancements, the possibility of applying this technology to tackle natural disasters will become more practical.
Source: VEGACOSMOS